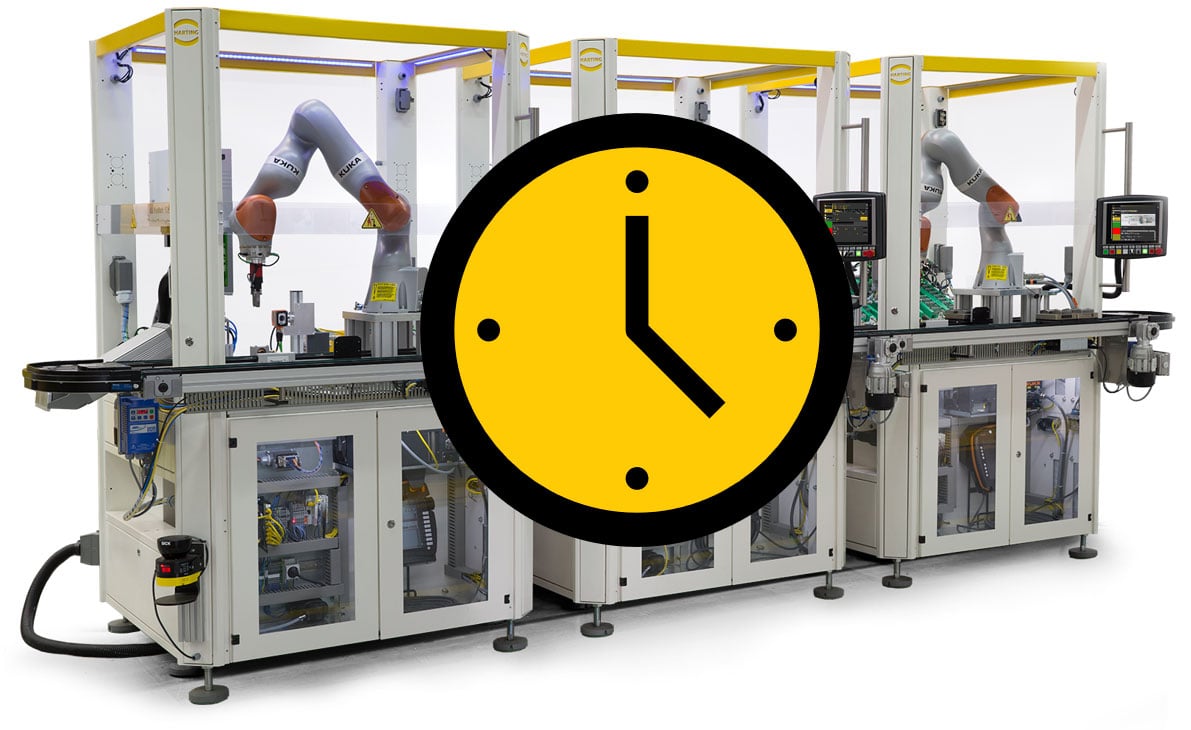
Machine data acquisition at HARTING Applied Technologies
An overview of your advantages
Is your machine currently in production? Were there any downtimes? Why were there downtimes? How much time elapses between when a machine stoppage and the start of troubleshooting?
To optimise and manage production capacities, certain data, which provides you with important information from your production environment, needs to be collected.
Machine data acquisition, which is part of the basic equipment from HARTING Applied Technologies, provides you with machine-specific process data in real time. These data are stored in a database where it can be used to depict chronological sequences. Machine data acquisition, MDA for short, takes into account the following data:
A company gains several advantages through the collection of machine data and the subsequent evaluation of the information presented:
- Extensive analysis of production processes
- Discovery of weak points
- Reproducibility of machine downtimes/malfunctions
- Optimisation of process flows
- Quality management
- Provision of data for continuous improvement process
- Basis for predictive maintenance
The structure of machine data acquisition
Machine data acquisition at HARTING Applied Technologies is implemented in combination with a Beckhoff controller, an Open Platform Communications Unified Architecture (OPC UA server) and a database. The collected data are visualised graphically on a user-friendly interface. This interface is divided into different dashboards:
- General machine information
- Malfunctions
- Order data of current order
- Order data
- Long-term monitoring
- Machine maintenance

The "General machine information" dashboard is intended to provide an overview of the machine's efficiency and productivity. It is possible to display the machine data for the entire machine, for individual cells and separately for the individual stations. For example, the general machine information shown here is from the "OK / NOK output [ST080]“ station dargestellt.

All occurred faults of the entire machine are displayed on the "Malfunctions" dashboard. It is possible to display the malfunctions for either the machine, the cell and at the station level. Along with the total number of faults, you can also see the malfunctions at the station level of the "Terminal 2 [ST060]" station shown here.

With the help of the "Order data of current order" dashboard, important parameters are visualised specifically for the current order in order to perform a quality control of the production quantity, among other things. The measurement results to be displayed can be selected individually.

The "Order data" dashboard collects all historical orders and stores them with their important parameters. Each order and the associated measured quantities can be selected individually and viewed in detail. The dashboard view shows the parameters of the historical order numbered "1111111" next to the general order list.

The "Long-term monitoring" dashboard records the operating times of all devices and the measurement results of all measured quantities of the machine. In order to view information clearly, it is possible to display only devices from a specific station or only from a specific device of one station. Similarly, the measured quantities can be selected individually. For example, measured quantity 1 and the "CylGreifer" device from the "Insert contacts [ST040]" station were selected here.

The different maintenance intervals of the entire machine are shown on the "Machine maintenance" dashboard. The maintenance intervals can be selected individually. Along with the general overview of all maintenance, you can see a detailed view of the "Daily maintenance".

Would you like to learn more?


